Grasshopper
I'm summarizing the Grasshopper files I've accumulated from my sophomore year to now, which I've used to create analytical graphics. I'll also provide a simple guide for architects who are interested in using them. If you're interested, why not give a shot at transitioning to a programmer's career? (Just kidding, or am I?)
This post was translated from my Chinese blog post with the aid of ChatGpt.
Grasshopper Introduction
Grasshopper is a parametric tool in Rhino, which can be thought of as a visual programming language. It is currently integrated into Rhino 6, but for Rhino 5, you need to install it separately. It is recommended to use Rhino 6, and you can download it from the Rhino official website. While Grasshopper is a plugin for Rhino, it has its own set of plugins available, such as Ladybug, ELK, and other analysis tools. You can search for and download these plugins on Food4Rhino.
All the Grasshopper files mentioned in this article will be uploaded to my GitHub.
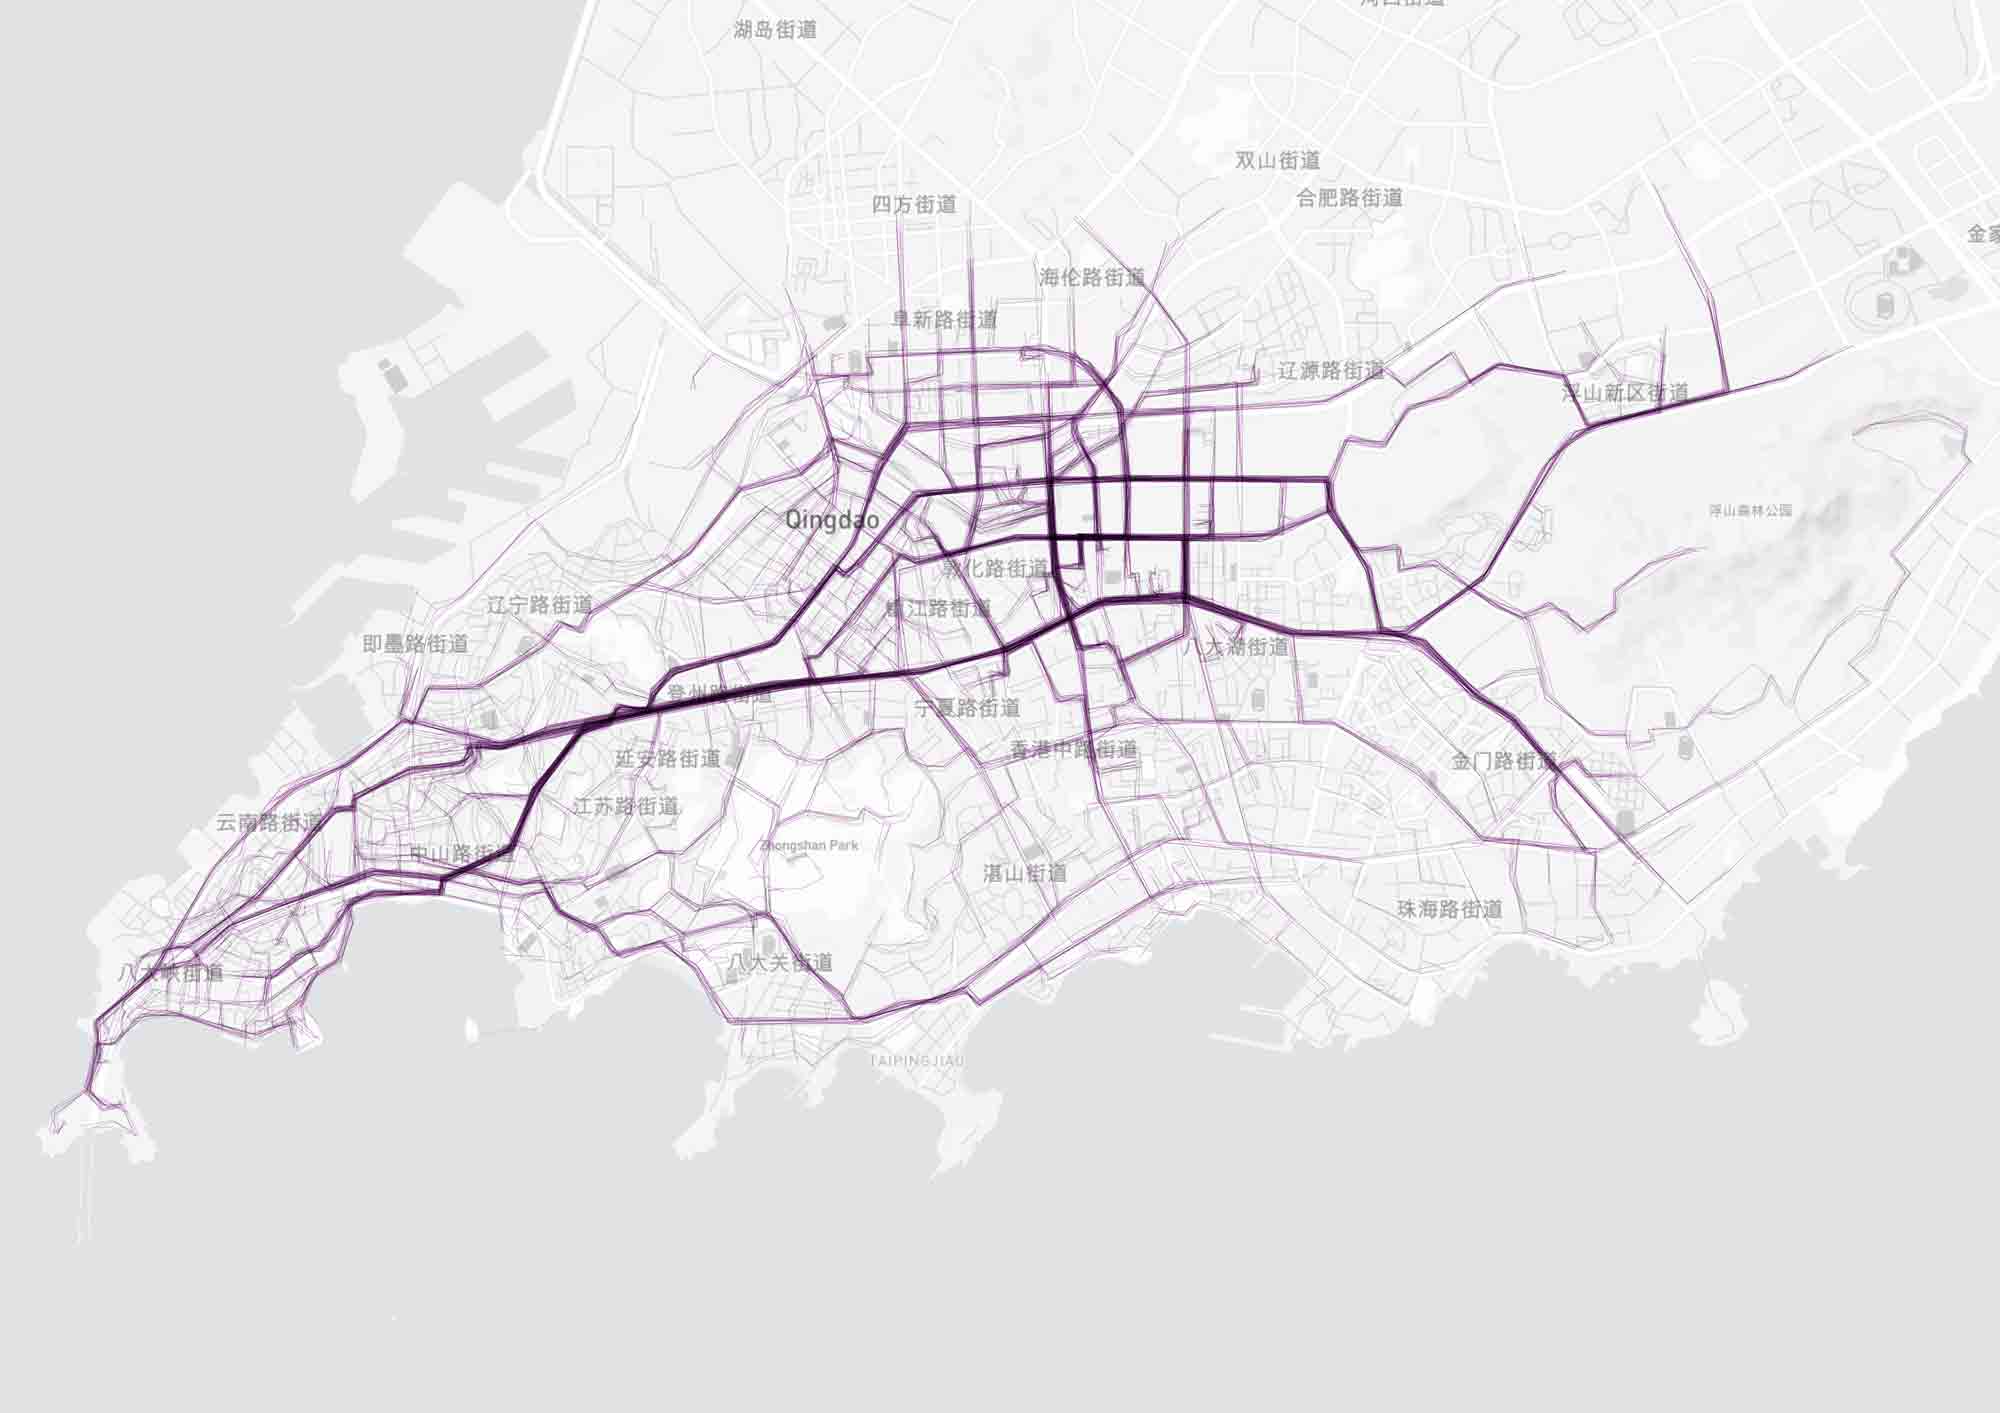
Pedestrian Flow Simulation
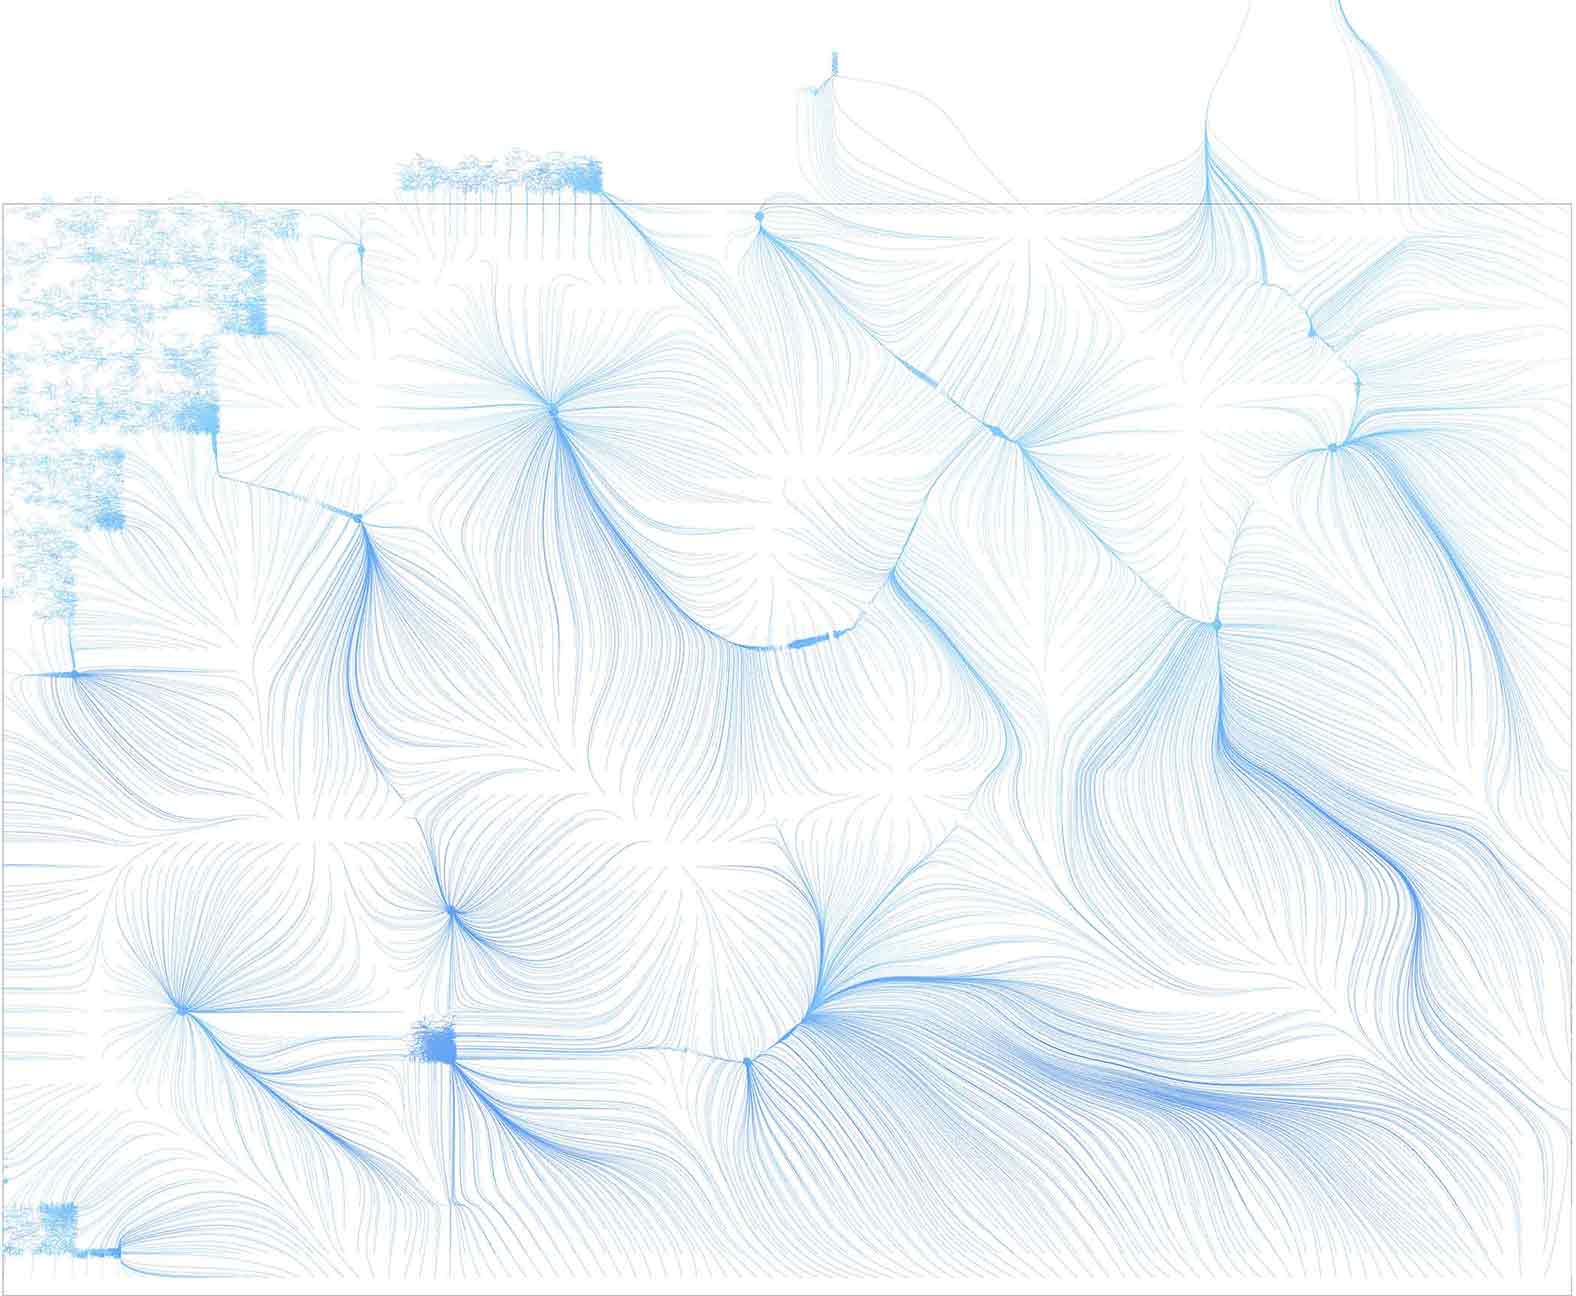
Pedestrian flow simulation is just a simulation because architects cannot find precise data. First, here is the download link for the pedestrian flow simulation.gh.
Next is a simple preview I made (using Qingdao as an example), representing the amount of pedestrian flow using different colors and line thicknesses.
Obtaining City Road Network
- To obtain the city road network, you need the ELK plugin ELK download link. Download and install it yourself. You may need a VPN, and it is recommended to install the latest version, 2.2.2.
- You also need to get an OSM file. Go to OpenStreetMap, click on the
Exportbutton in the upper left corner, and selectManually select different areasin the left sidebar. If the selected area is large, consider using theOverpass APIfor export. - Click the
Exportbutton, choose a file path and name for the OSM file. You will need it in the next step. - Open the Grasshopper file you downloaded earlier, right-click on the
OSM filecomponent on the left, selectSelect one existing file,and choose the OSM file you just downloaded. Wait for it to load. - Right-click on the
Bake Roadscomponent on the left and selectBaketo obtain the road network.
Simulating Pedestrian Origins
- Right-click on the
Pedestrian Originscomponent, selectSelect multiple points,and choose densely populated points. - Adjust the
DistanceandLevelssliders to simulate the density of pedestrian flow. - Right-click on the
Land Areacomponent to select the approximate area of the land without coastlines.
Generating Simulated Streamlines
- Select the road network that was
bakedearlier, type theungroupcommand, and then type theexplodecommand to break it into smaller segments. - Right-click on the
Decompose Road Networkcomponent, selectSet multiple curves,and select the decomposed road network. - Fine-tune the lines using the
ToleranceandLine Thicknesssliders. - Right-click on the
Streamlinescomponent and select theBakeoption. Check theGroupoption and chooseYes, pleasebehind it. - In Rhino, select the
bakedstreamlines, clickFile,and selectExport Selected.Export it as anAdobe Illustratorfile.
Beautification
- Open the exported file in
Adobe Illustrator. - Adjust the stroke color and thickness.
- Set the opacity to around 70% and choose the
Multiplyblending mode. - Download a map background for the corresponding area from Mapbox and overlay it below the streamlines.
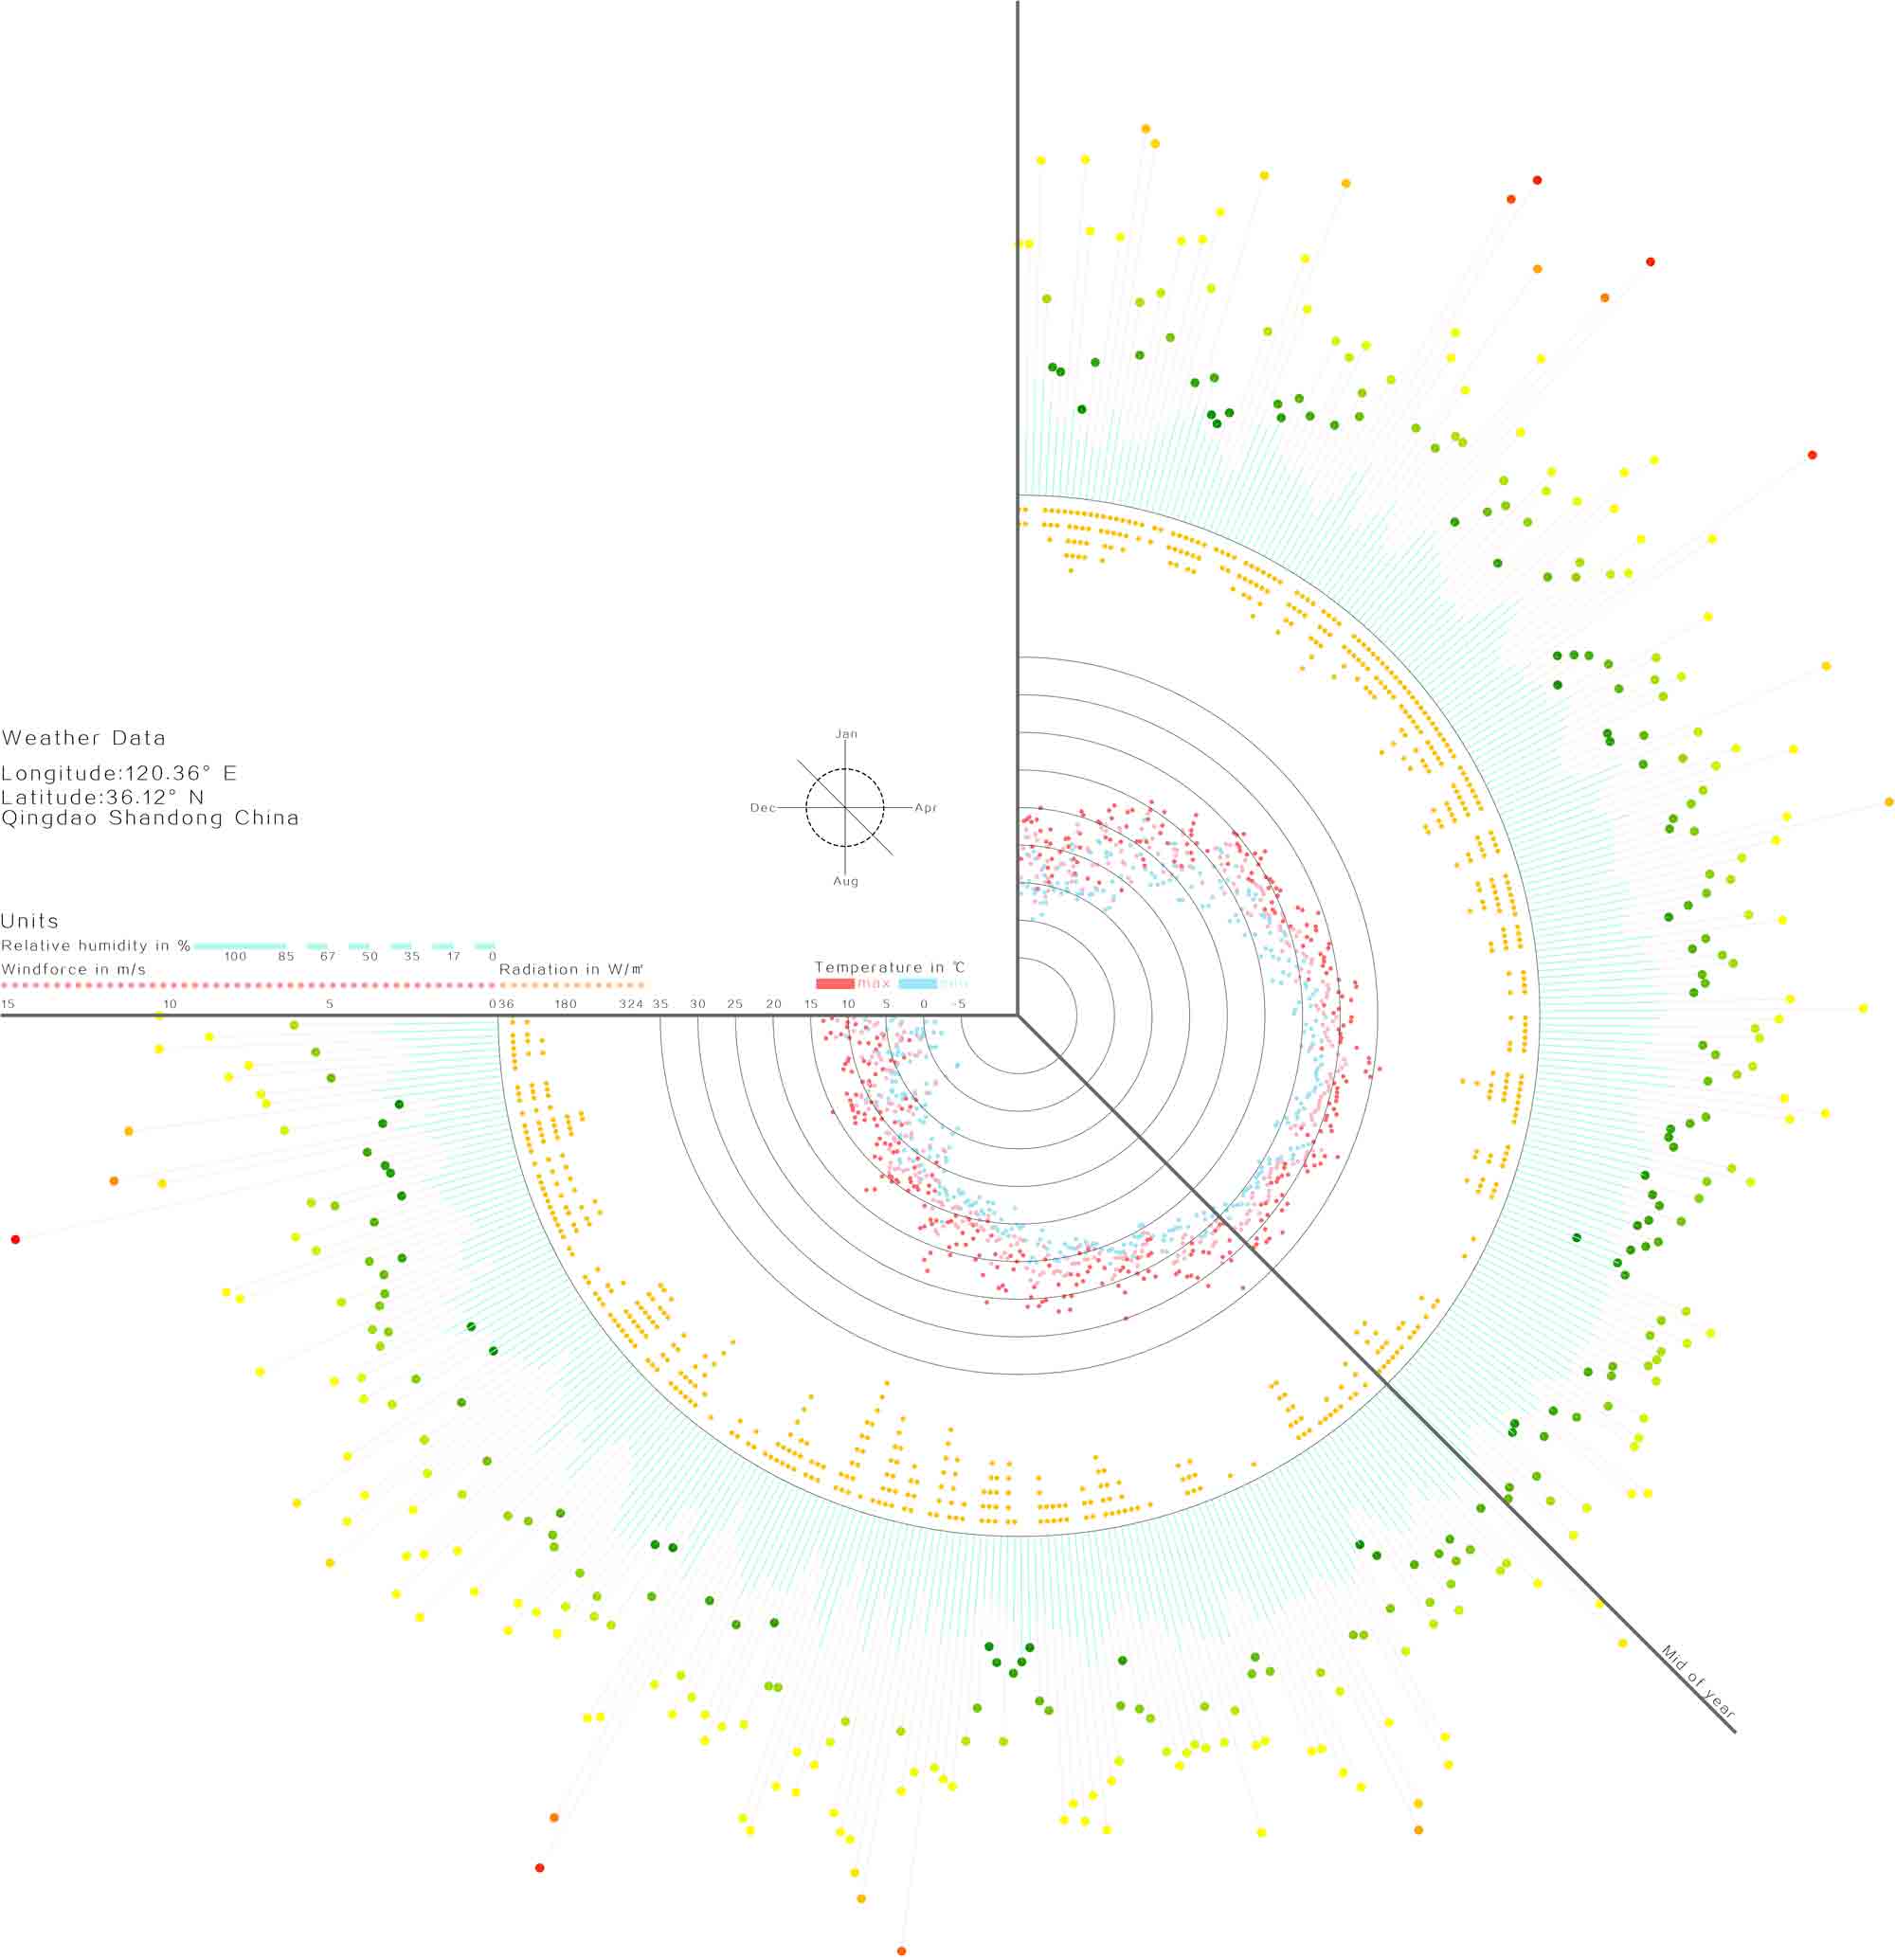
Comprehensive Meteorological Information
Meteorological information charts can represent information such as wind speed, temperature, humidity, precipitation, and more in a single image. Here’s the download link for the comprehensive meteorological information.gh.
Next is a preview (using Qingdao as an example) where the compression is quite severe.
Obtaining Meteorological Information Files
Meteorological information requires the use of an epw file for importing. Currently, there are two ways to obtain epw files. One is to download them from the EnergyPlus website, but the data for Chinese cities is limited (Qingdao is not available, and the nearest one is Juxian). The other method is to use the wea files of Chinese cities, which can be found by searching online. Convert these wea files to epw using Ecotect’s weather tool. To do this, open Ecotect’s weather tool, click File in the upper left corner, and select Save as to save the file as epw.
Here is the link to the Qingdao meteorological file Qingdao epw file. If you need files for other areas, you can send me an email.
Adjusting the Analysis Chart
The chart describes the following information:
- Maximum temperature
- Minimum temperature
- Average temperature
- Relative humidity
- Wind speed
- Solar radiation
Adjustment options are marked on the left side of the Grasshopper file. Simply adjust them based on your selections.
Beautification
Bake each option in the chart one by one and group them. Export as an Adobe Illustrator file. In Adobe Illustrator, you can continue to adjust colors and line styles and add relevant information such as units and locations.
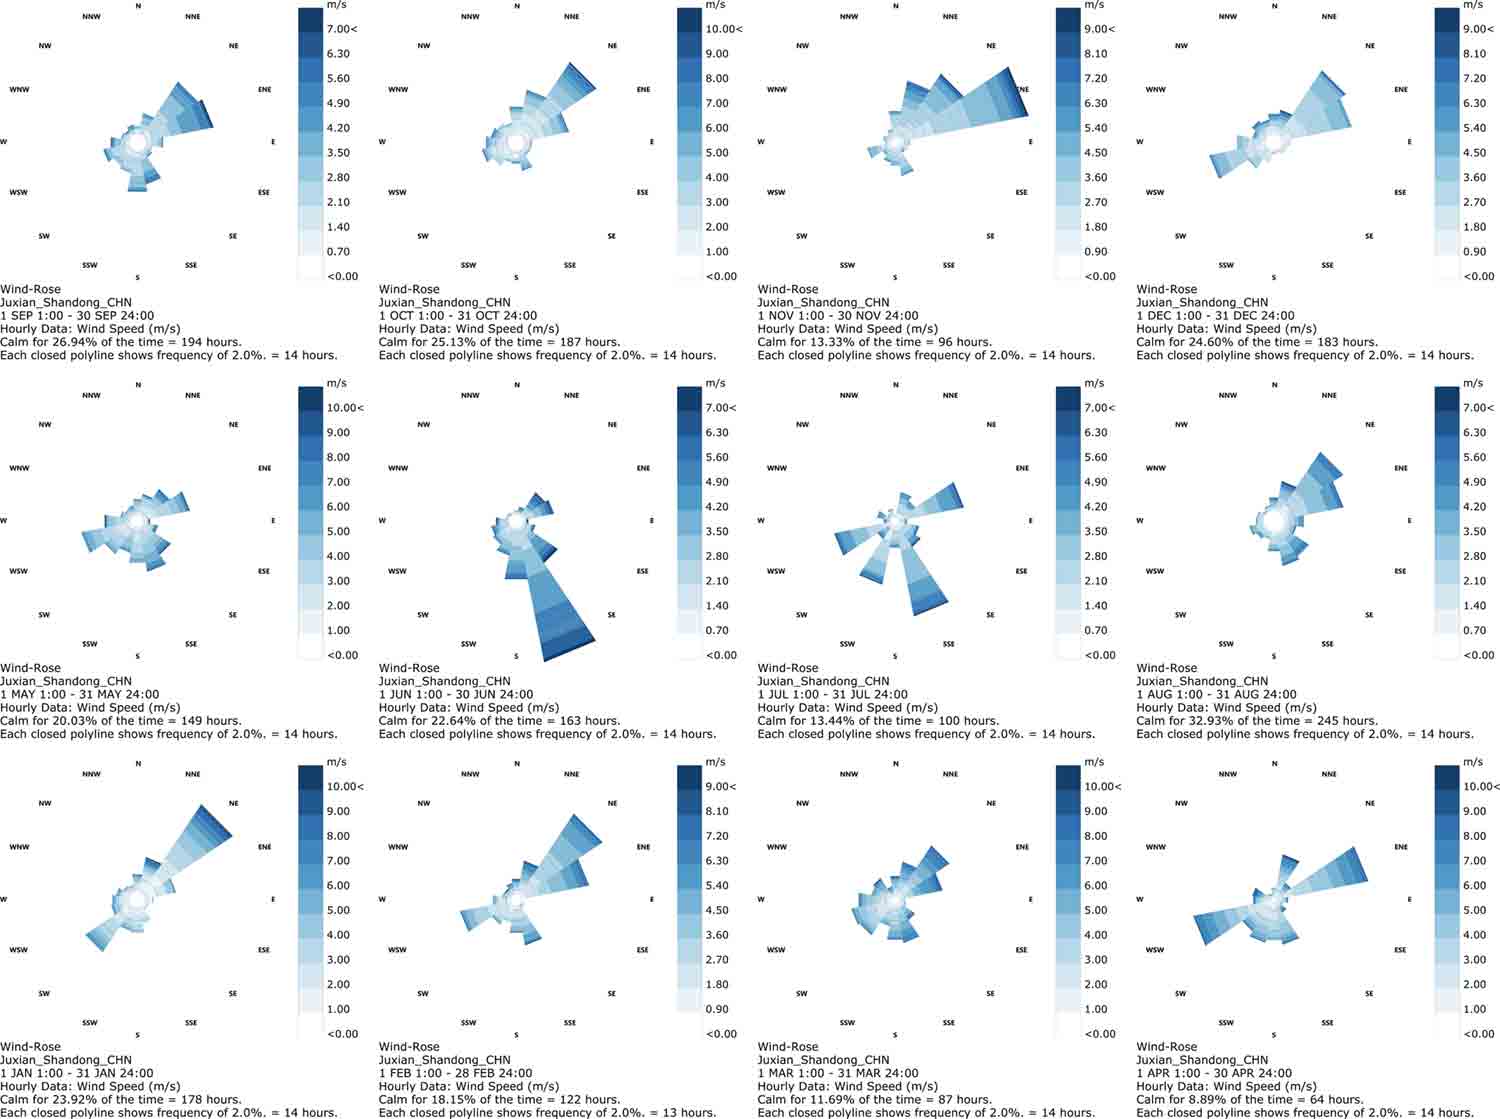
Wind Rose
The wind rose chart component can extract wind environment information from epw files. Here’s the download link for the wind rose.gh.
Below is a preview.
Obtaining Meteorological Files
For wind rose charts, it is recommended to download meteorological files only from the EnergyPlus website because files converted by Ecotect may have issues.
How to Use
The wind rose chart component is straightforward to use, and here are the steps:
- Double-click on the
Import epw filecomponent’sfalsebutton to activate it totrue. - In the pop-up file manager, select the
epwfile you want to use. - Adjust the
Start MonthandEnd Monthsliders to specify the months you want to display on the wind rose. - Use the
Scale Factor,Grid Size,andRadiussliders to adjust the size of the wind rose. It’s recommended not to set these too high to avoid performance issues. - Adjust the
X-Axis CountandY-Axis Countto change the arrangement of the wind roses. - Use the
Color Schemeslider to select color schemes from the Ladybug collection. - Use the
Swatchcomponent to adjust the background color of the wind rose. - Double-click on the
Start Calculationcomponent’sfalsebutton to activate it totrue.Wait for a while, and you will see the generated wind roses in Rhino.
Site Elevation Map 1
The principle behind the first type of site elevation map is quite simple (so it might not look that great). It generates grid points on the terrain surface. The elevation is determined based on the z-axis coordinates of these grid points, and different colors are assigned accordingly. Here’s the download link for the site elevation 1.gh.
Here’s a preview image:

Obtaining Terrain Data
Obtaining terrain data is relatively simple. Use SketchUp to add location information and import maps. Save in a lower version and then import it into Rhino. The downside is that the accuracy might be relatively low, but it’s sufficient for many cases.
How to Use the Component
- Right-click on the
Terrain Surfacecomponent on the left and chooseSet one surface.In Rhino, select the imported terrain surface. - Adjust the density of elevation points using the
X-Axis Grid Count,Y-Axis Grid Count,andGrid Sizesliders. - Set the
Edge Thicknessslider to 0 to display solid color blocks. - In Rhino, use the
ViewCapturetoFilecommand to save the elevation image.
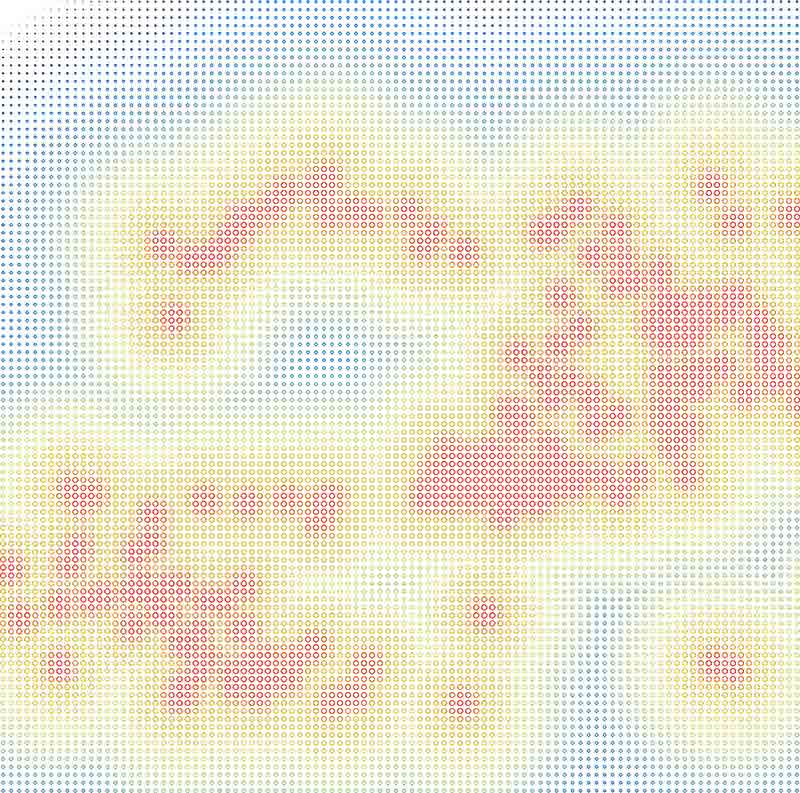
Heatmap
The heatmap uses the ELK plugin to extract information from the map and generates different colors and sizes of hotspots based on proximity. To use the heatmap component, you’ll need to download and install the LunchBox and ELK plugins. You can find them on Food4Rhino. Here’s the download link for the heatmap.gh.
Here’s a preview image:
How to Use the Component
- Right-click on the
File Pathcomponent and chooseSelect one existing file.Locate the correspondingosmmap file. - Right-click on the
OSM Datacomponent on the right. InFeature type,select the type for which you want to generate hotspots. - Right-click on the
Rangecomponent and draw a rectangle in Rhino to define the analysis area. - Adjust the hotspot density using the
X-Axis CountandY-Axis Countsliders. - Adjust the line thickness of hotspots using the
Circle Widthslider. - Use the
Scaleslider to control the size of the circles. Coordinate it with the two components mentioned above. - Use the
Gradientcomponent to adjust colors. - In Rhino, use the
ViewCapturetoFilecommand to export the image for post-processing in Photoshop.
Site Rainwater Runoff
Site rainwater runoff mainly uses the Mosquito plugin. It simulates the movement trajectory of rainwater projected onto the site’s terrain surface from different points to simulate the flow of rainwater. Here’s the download link for the runoff.gh.
Here’s a preview image:
How to Use the Component
- Import the terrain as a surface into Rhino and select it.
- Open the GH file, right-click on the
Surfacecomponent, and chooseSet one surface. - Adjust the accuracy of the simulation with the following two components. Keep in mind that higher values will slow down the simulation.
- Use the
U CountandV Countsliders to adjust the density of rainfall points, simulating rainfall size. - When adjusting parameters, make sure the
SDividecomponent remains closed; otherwise, it might slow down the process significantly. Only open it after adjusting other parameters. - In Rhino, use the
ViewCapturetoFilecommand to export an image for further post-processing.
Sunlight Analysis
This component can be used as an alternative to Tianzheng’s sunlight analysis when creating technical drawings. It analyzes the sunlight hours.
Here’s the download link for sunlight analysis.
How to Use the Component
- Double-click on
Importand select theepwfile in the pop-up window. - Set the north direction using vectors.
- For the date, it’s recommended to choose a date with the least sunlight, but standards may vary depending on the location.
- Calculations can overlap for objects and obstructions.
- Adjust the
gridSizeanddisFromBasefor calculation accuracy, but don’t set them too high, or it might become very slow. If you see a large area of the same color in the result, it means the accuracy is too low. - The four buttons in the lower-left corner are used to adjust output details.
- Double-click on
Start Calculationto initiate the process. The time it takes depends on accuracy and model size.
Some Additional Features
- Vertical Tides
- Fragmented Skin
Update
June 24, 2020
Nothing below this point…
Due to the excitement after submitting the graduation project, I accidentally deleted all the architectural data and forgot to upload it. I just remembered that I had an unfinished blog post… (Escape… ε=ε=ε=┏(゜ロ゜;)┛)